Grundlæggende statistik
| Institutionelle ejere | 201 total, 199 long only, 0 short only, 2 long/short - change of -3,72% MRQ |
| Gennemsnitlig porteføljeallokering | 0.2981 % - change of -33,40% MRQ |
| Institutionelle aktier (lange) | 190.893.692 (ex 13D/G) - change of 10,96MM shares 2,87% MRQ |
| Institutionel værdi (lang) | $ 2.326.361 USD ($1000) |
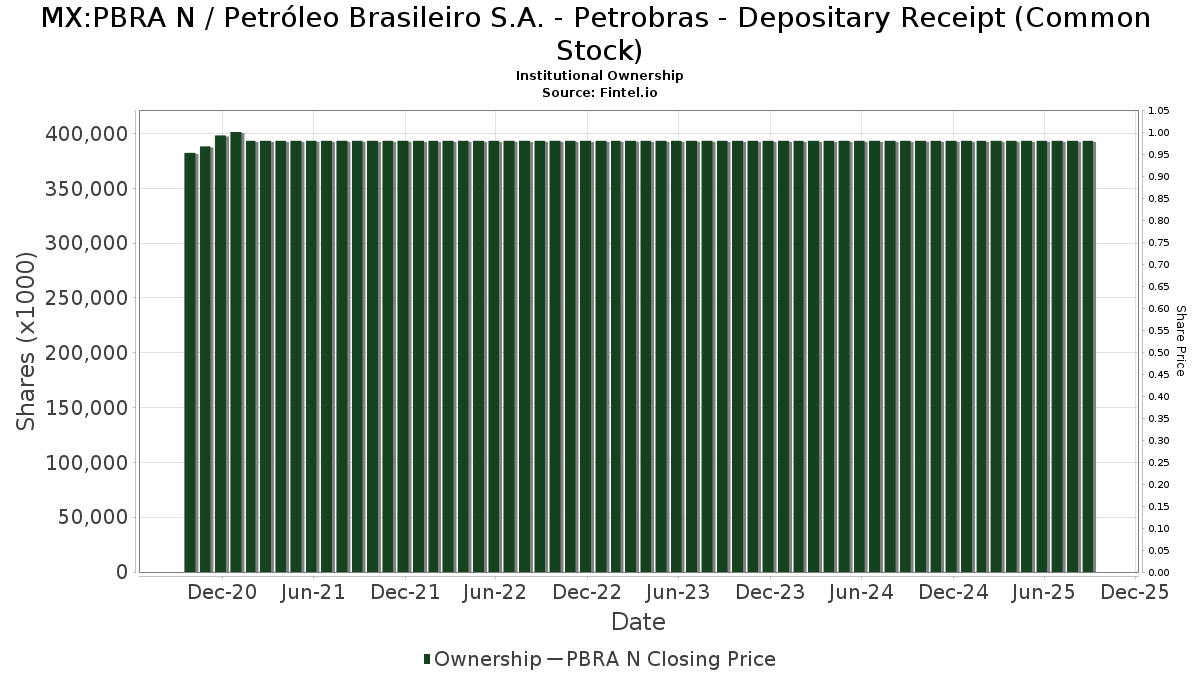
Institutionelt ejerskab og aktionærer
Petróleo Brasileiro S.A. - Petrobras - Depositary Receipt (Common Stock) (MX:PBRA N) har 201 institutionelle ejere og aktionærer, der har indsendt 13D/G- eller 13F-formularer til Securities Exchange Commission (SEC). Disse institutioner har i alt 190,893,692 aktier. Største aktionærer omfatter Robeco Institutional Asset Management B.V., Jpmorgan Chase & Co, BlackRock, Inc., Massachusetts Financial Services Co /ma/, Itau Unibanco Holding S.A., Dimensional Fund Advisors Lp, Amundi, Delaware Management Holdings, Inc., Brandes Investment Partners, Lp, and State Street Corp .
Petróleo Brasileiro S.A. - Petrobras - Depositary Receipt (Common Stock) (BMV:PBRA N) institutionel ejerskabsstruktur viser aktuelle positioner i virksomheden efter institutioner og fonde, samt seneste ændringer i positionsstørrelse. Større aktionærer kan omfatte individuelle investorer, investeringsforeninger, hedgefonde eller institutioner. Skema 13D angiver, at investoren besidder (eller besidder) mere end 5 % af virksomheden og har til hensigt (eller har til hensigt at) aktivt at forfølge en ændring i forretningsstrategi. Skema 13G indikerer en passiv investering på over 5%.
Fondens stemningsscore
Fund Sentiment Score (fka Ownership Accumulation Score) finder de aktier, der bliver mest købt af fonde. Det er resultatet af en sofistikeret, multi-faktor kvantitativ model, der identificerer virksomheder med de højeste niveauer af institutionel akkumulering. Scoringsmodellen bruger en kombination af den samlede stigning i oplyste ejere, ændringerne i porteføljeallokeringer i disse ejere og andre målinger. Tallet går fra 0 til 100, hvor højere tal indikerer et højere niveau af akkumulering for sine jævnaldrende, og 50 er gennemsnittet.
Opdateringsfrekvens: Dagligt
Se Ownership Explorer, som giver en liste over højest rangerende virksomheder.
AI+ Ask Fintel’s AI assistant about Petróleo Brasileiro S.A. - Petrobras - Depositary Receipt (Common Stock).
Select a question to share a public post with an AI-crafted answer.
Thinking of good questions…
13F og NPORT arkivering
Detaljer om 13F-arkivering er gratis. Detaljer om NP-ansøgninger kræver et premium-medlemskab. Grønne rækker angiver nye positioner. Røde rækker angiver lukkede positioner. Klik på linket ikon for at se den fulde transaktionshistorik.
Opgrader
for at låse premium-data op og eksportere til Excel ![]() .
.
| Fil dato | Kilde | Investor | Type | Gennemsnitlig pris (Øst) |
Aktier | Δ Aktier (%) |
Rapporteret Værdi ($1000) |
Δ Værdi (%) |
Port Alloc (%) |
|
|---|---|---|---|---|---|---|---|---|---|---|
| 2026-02-13 | 13F | Flow Traders U.s. Llc | 57.305 | 1 | ||||||
| 2026-02-17 | 13F | Lazard Asset Management Llc | 130.232 | -13,71 | 1.468 | -17,72 | ||||
| 2026-04-06 | 13F | GAMMA Investing LLC | 3.584 | 36,90 | 67 | 131,03 | ||||
| 2025-10-30 | 13F | Twin Peaks Wealth Advisors, LLC | 0 | -100,00 | 0 | |||||
| 2026-02-17 | 13F | XTX Topco Ltd | 69.114 | 779 | ||||||
| 2026-02-17 | 13F | Price T Rowe Associates Inc /md/ | 1.331.789 | 0,00 | 15 | 0,00 | ||||
| 2026-02-02 | 13F | Qrg Capital Management, Inc. | 39.945 | 19,85 | 450 | 14,50 | ||||
| 2026-02-17 | 13F | Jones Financial Companies Lllp | 4.681 | 166,12 | 53 | 147,62 | ||||
| 2026-02-17 | 13F | Engineers Gate Manager LP | 64.449 | -63,19 | 726 | -64,91 | ||||
| 2026-02-10 | 13F/A | Northwestern Mutual Wealth Management Co | 496 | 0,00 | 6 | 0,00 | ||||
| 2026-02-13 | 13F | Mml Investors Services, Llc | 10.366 | 117 | ||||||
| 2026-04-10 | 13F | Naviter Wealth, LLC | 26.232 | -7,00 | 492 | 50,15 | ||||
| 2026-02-13 | 13F | Ieq Capital, Llc | 10.861 | -23,22 | 122 | -26,95 | ||||
| 2025-11-07 | 13F | Sierra Ocean, Llc | 0 | -100,00 | 0 | |||||
| 2026-02-17 | 13F | Citadel Advisors Llc | 423.756 | 4.776 | ||||||
| 2026-04-09 | 13F | DHJJ Financial Advisors, Ltd. | 908 | 0,00 | 17 | 70,00 | ||||
| 2026-02-17 | 13F | Citadel Advisors Llc | Call | 16.300 | -68,29 | 184 | -69,85 | |||
| 2026-02-17 | 13F | Royal Bank Of Canada | 701.382 | 15,78 | 7.904 | 10,39 | ||||
| 2026-02-17 | 13F | Citadel Advisors Llc | Put | 26.800 | 40,31 | 302 | 34,22 | |||
| 2026-02-17 | 13F | Northern Trust Corp | 2.078.298 | 17,26 | 23.422 | 11,80 | ||||
| 2026-02-13 | 13F | Great West Life Assurance Co /can/ | 114.904 | 0,00 | 1 | 0,00 | ||||
| 2026-01-15 | 13F | Allspring Global Investments Holdings, LLC | 938.000 | -17,63 | 10.628 | -20,50 | ||||
| 2026-02-12 | 13F | Jane Street Group, Llc | 462.864 | 5.216 | ||||||
| 2025-11-12 | 13F | Simplex Trading, Llc | 0 | -100,00 | 0 | |||||
| 2025-11-12 | 13F | Insigneo Advisory Services, Llc | 0 | -100,00 | 0 | |||||
| 2025-11-13 | 13F | Total Investment Management Inc | 0 | -100,00 | 0 | |||||
| 2026-02-12 | 13F | Jane Street Group, Llc | Call | 44.300 | 499 | |||||
| 2026-02-13 | 13F | Wells Fargo & Company/mn | 873.846 | 13,53 | 9.848 | 8,24 | ||||
| 2026-02-13 | 13F | Segall Bryant & Hamill, Llc | 54.100 | 0,00 | 610 | -4,69 | ||||
| 2026-02-13 | 13F | Mariner, LLC | 16.159 | 0,04 | 182 | -4,21 | ||||
| 2026-02-12 | 13F | Brown Brothers Harriman & Co | 989 | 11 | ||||||
| 2026-01-28 | 13F | WIT Partners Advisory Pte. Ltd. | 43.500 | 466 | ||||||
| 2026-02-13 | 13F | Cape Ann Asset Management Ltd | 574.311 | 26,33 | 6.472 | 20,45 | ||||
| 2026-02-17 | 13F | one8zero8, LLC | 400 | 0,00 | 5 | 0,00 | ||||
| 2026-02-17 | 13F | Private Advisor Group, LLC | 21.062 | -7,40 | 237 | -11,57 | ||||
| 2025-11-14 | 13F | Cubist Systematic Strategies, LLC | 362.046 | 4.279 | ||||||
| 2026-02-13 | 13F | Sei Investments Co | 153.215 | -12,08 | 1.727 | -16,17 | ||||
| 2026-01-07 | 13F | Holistic Financial Partners | 14.768 | 0,00 | 166 | -4,60 | ||||
| 2026-02-11 | 13F | Group One Trading, L.p. | 120.026 | 1.353 | ||||||
| 2026-04-16 | 13F | Stanley-Laman Group, Ltd. | 174.807 | 3.627 | ||||||
| 2026-02-13 | 13F | SRS Capital Advisors, Inc. | 2.515 | 446,74 | 28 | 460,00 | ||||
| 2026-02-17 | 13F | Balyasny Asset Management Llc | 21.185 | 239 | ||||||
| 2026-04-24 | 13F | Pzena Investment Management Llc | 196.970 | 57,70 | 3.693 | 162,47 | ||||
| 2026-02-11 | 13F | Franklin Resources Inc | 370.892 | 5,66 | 4.180 | 0,75 | ||||
| 2026-02-13 | 13F | Macquarie Group Ltd | 0 | -100,00 | 0 | |||||
| 2026-02-17 | 13F | Millennium Management Llc | 420.984 | 53,89 | 4.744 | 46,74 | ||||
| 2026-01-22 | 13F | Massachusetts Financial Services Co /ma/ | 14.467.014 | -0,57 | 163.043 | -5,19 | ||||
| 2026-04-14 | 13F | Nbc Securities, Inc. | 68.597 | -32,66 | 1.286 | 12,02 | ||||
| 2025-11-13 | 13F | Farringdon Capital, Ltd. | 0 | -100,00 | 0 | |||||
| 2026-02-12 | 13F | Quadrant Capital Group Llc | 16.960 | 0,00 | 191 | -4,50 | ||||
| 2026-02-13 | 13F | National Bank Of Canada /fi/ | 2.120 | 34,43 | 24 | 27,78 | ||||
| 2026-02-13 | 13F | Rhumbline Advisers | 28.635 | -15,48 | 323 | -19,50 | ||||
| 2026-01-14 | 13F | Hennion & Walsh Asset Management, Inc. | 78.290 | -38,54 | 882 | -41,40 | ||||
| 2026-02-17 | 13F | Mercer Global Advisors Inc /adv | 0 | -100,00 | 0 | |||||
| 2026-02-13 | 13F | Panagora Asset Management Inc | 17.551 | 0,00 | 198 | -4,83 | ||||
| 2026-02-17 | 13F | Qube Research & Technologies Ltd | 94.079 | -93,15 | 1.060 | -93,47 | ||||
| 2026-02-06 | 13F | Larson Financial Group LLC | 880 | 0,00 | 10 | -10,00 | ||||
| 2026-04-22 | 13F | Spire Wealth Management | 78 | 0,00 | 1 | |||||
| 2026-02-05 | 13F | Northwestern Mutual Investment Management Company, Llc | 76.504 | 0,00 | 862 | -4,65 | ||||
| 2026-02-13 | 13F | Y-Intercept (Hong Kong) Ltd | 729.749 | 4,53 | 8.224 | -0,33 | ||||
| 2026-01-23 | 13F | Assetmark, Inc | 1.303 | 72,35 | 15 | 75,00 | ||||
| 2025-11-14 | 13F | Public Employees Retirement System Of Ohio | 0 | -100,00 | 0 | -100,00 | ||||
| 2025-11-14 | 13F | Credit Agricole S A | 0 | -100,00 | 0 | |||||
| 2026-02-02 | 13F | Cornerstone Planning Group LLC | 0 | -100,00 | 0 | |||||
| 2026-04-13 | 13F | Salem Investment Counselors Inc | 53 | 1 | ||||||
| 2025-11-13 | 13F | Connor, Clark & Lunn Investment Management Ltd. | 0 | -100,00 | 0 | |||||
| 2025-11-07 | 13F/A | Abn Amro Investment Solutions | 46.460 | -19,42 | 637 | -10,80 | ||||
| 2026-02-02 | 13F | Montag A & Associates Inc | 1.671 | 8,37 | 19 | 5,56 | ||||
| 2026-02-17 | 13F | Cetera Investment Advisers | 14.707 | -20,58 | 166 | -24,31 | ||||
| 2026-02-11 | 13F | IMA Wealth, Inc. | 109 | 1 | ||||||
| 2026-02-12 | 13F | BRYN MAWR TRUST Co | 22.250 | 0,00 | 251 | -4,58 | ||||
| 2026-02-12 | 13F | Principal Securities, Inc. | 0 | -100,00 | 0 | |||||
| 2026-04-21 | 13F | Robeco Institutional Asset Management B.V. | 31.027.467 | 13,84 | 581.765 | 89,40 | ||||
| 2026-04-16 | 13F | SG Americas Securities, LLC | 12.785 | -72,23 | 0 | |||||
| 2026-02-17 | 13F | Tower Research Capital LLC (TRC) | 258 | -97,74 | 3 | -98,51 | ||||
| 2026-01-30 | 13F | R Squared Ltd | 18.349 | 207 | ||||||
| 2026-02-17 | 13F | Aqr Capital Management Llc | 63.666 | -38,70 | 718 | -45,43 | ||||
| 2026-02-17 | 13F | D. E. Shaw & Co., Inc. | 0 | -100,00 | 0 | |||||
| 2026-01-27 | 13F | First Horizon Corp | 1.480 | 0,00 | 17 | -5,88 | ||||
| 2026-01-26 | 13F | Cwm, Llc | 557 | -24,73 | 0 | |||||
| 2026-01-29 | 13F | Vanguard Group Inc | 2.619.519 | 0,28 | 29.522 | -4,39 | ||||
| 2026-04-13 | 13F | IFP Advisors, Inc | 0 | -100,00 | 0 | |||||
| 2026-04-13 | 13F | Augustine Asset Management Inc | 14.511 | 0,00 | 272 | 66,87 | ||||
| 2026-02-13 | 13F | Van Eck Associates Corp | 58.255 | 16,42 | 1 | |||||
| 2026-02-12 | 13F | Qtron Investments LLC | 0 | -100,00 | 0 | |||||
| 2026-02-06 | 13F/A | Rathbone Brothers plc | 20.500 | 0,00 | 231 | -4,55 | ||||
| 2026-02-11 | 13F | Parallel Advisors, LLC | 385 | -61,31 | 4 | -63,64 | ||||
| 2026-02-17 | 13F | Janus Henderson Group Plc | 314.000 | 21,14 | 3.540 | 15,50 | ||||
| 2026-03-25 | 13F/A | Lifetime Wealth Management P.C. | 668.800 | 7.537 | ||||||
| 2026-02-17 | 13F | Blair William & Co/il | 1.088 | 41,67 | 12 | 33,33 | ||||
| 2026-02-03 | 13F | Sequoia Financial Advisors, LLC | 13.335 | 0,73 | 150 | -3,85 | ||||
| 2026-02-06 | 13F | HighTower Advisors, LLC | 11.408 | -4,26 | 129 | -8,57 | ||||
| 2026-02-10 | 13F | Goldman Sachs Group Inc | 724.779 | -6,40 | 8.168 | -10,75 | ||||
| 2026-03-16 | 13F/A | Rockefeller Capital Management L.P. | 15.249 | 1,82 | 172 | -3,39 | ||||
| 2026-02-03 | 13F | Crossmark Global Holdings, Inc. | 166.569 | -12,55 | 1.877 | -16,61 | ||||
| 2026-02-12 | 13F | Steward Partners Investment Advisory, Llc | 1.262 | 39,76 | 14 | 40,00 | ||||
| 2026-02-06 | 13F | Global Retirement Partners, LLC | 9.074 | 1.342,61 | 102 | 1.357,14 | ||||
| 2026-02-17 | 13F | Susquehanna International Group, Llp | Put | 76.700 | -57,13 | 864 | -59,13 | |||
| 2026-02-17 | 13F | Susquehanna International Group, Llp | Call | 659.700 | -77,57 | 7.435 | -78,62 | |||
| 2026-02-11 | 13F | Cerity Partners LLC | 27.253 | -36,48 | 307 | -39,45 | ||||
| 2026-02-13 | 13F | Natixis | 340.900 | 3.842 | ||||||
| 2026-02-06 | 13F | Pnc Financial Services Group, Inc. | 13.663 | -4,91 | 154 | -9,47 | ||||
| 2026-02-12 | 13F | Rossby Financial, LCC | 27 | 0,00 | 0 | |||||
| 2026-02-17 | 13F | Voloridge Investment Management, Llc | 0 | -100,00 | 0 | |||||
| 2026-02-10 | 13F | Daiwa Securities Group Inc. | 86.600 | 8,79 | 1 | |||||
| 2026-02-17 | 13F | Susquehanna International Group, Llp | 143.443 | 656,00 | 1.617 | 621,43 | ||||
| 2026-02-13 | 13F | Atlas Capital Advisors Llc | 12.193 | 0,00 | 137 | -2,14 | ||||
| 2026-02-13 | 13F | LRT Capital Management, LLC | 0 | -100,00 | 0 | |||||
| 2026-02-23 | 13F | Vinland Capital Management Gestora de Recursos LTDA. | 0 | -100,00 | 0 | -100,00 | ||||
| 2026-04-22 | 13F | Pinnacle Bancorp, Inc. | 1.136 | -42,01 | 21 | -4,55 | ||||
| 2026-01-28 | 13F | B. Metzler seel. Sohn & Co. AG | 65.278 | 0,00 | 736 | -4,67 | ||||
| 2026-02-12 | 13F | BlackRock, Inc. | 17.153.167 | 30,96 | 193.316 | 24,86 | ||||
| 2026-02-13 | 13F | Vontobel Holding Ltd. | 30.000 | 0,00 | 338 | -4,52 | ||||
| 2025-11-19 | 13F/A | Regions Financial Corp | 0 | -100,00 | 0 | |||||
| 2025-11-12 | 13F | NewSquare Capital LLC | 0 | -100,00 | 0 | |||||
| 2025-11-13 | 13F | Jump Financial, LLC | 0 | -100,00 | 0 | |||||
| 2026-04-15 | 13F | Financial Management Professionals, Inc. | 958 | 18 | ||||||
| 2026-02-06 | 13F | Gsa Capital Partners Llp | 0 | -100,00 | 0 | |||||
| 2026-04-13 | 13F | True Wealth Design, LLC | 224 | 3,70 | 4 | 100,00 | ||||
| 2026-04-24 | 13F | Root Financial Partners, LLC | 81 | 2 | ||||||
| 2026-02-13 | 13F | Pathstone Holdings, LLC | 19.909 | 8,89 | 225 | 3,70 | ||||
| 2026-01-16 | 13F | Standard Life Aberdeen plc | 321.850 | 46,12 | 3.627 | 38,28 | ||||
| 2026-02-17 | 13F | State Of Wisconsin Investment Board | 0 | -100,00 | 0 | |||||
| 2026-02-13 | 13F | Citigroup Inc | 3.947 | -85,23 | 44 | -86,03 | ||||
| 2026-02-20 | 13F | Sunbelt Securities, Inc. | 2.135 | 24 | ||||||
| 2026-04-03 | 13F | Adirondack Trust Co | 1.000 | 0,00 | 19 | 63,64 | ||||
| 2026-01-30 | 13F | State of New Jersey Common Pension Fund D | 1.008.336 | 11.364 | ||||||
| 2026-01-30 | 13F | Sigma Planning Corp | 12.800 | -12,93 | 144 | -16,76 | ||||
| 2026-01-23 | 13F | Baillie Gifford & Co | 3.768.768 | -0,13 | 42.474 | -4,78 | ||||
| 2026-02-17 | 13F | Bank Of America Corp /de/ | 893.995 | 35,55 | 10.075 | 29,25 | ||||
| 2026-01-12 | 13F | AllSquare Wealth Management LLC | 698 | 0,00 | 8 | 0,00 | ||||
| 2026-02-19 | 13F | TMB Capital Partners, LLC | 10.094 | 114 | ||||||
| 2026-02-17 | 13F | Gotham Asset Management, LLC | 50.150 | -0,30 | 565 | -4,88 | ||||
| 2026-04-23 | 13F | Oppenheimer Asset Management Inc. | 55.998 | -27,94 | 1.050 | 19,89 | ||||
| 2026-04-07 | 13F | Farther Finance Advisors, LLC | 1.587 | -5,48 | 29 | 61,11 | ||||
| 2026-02-17 | 13F/A | Cantor Fitzgerald, L. P. | 0 | -100,00 | 0 | -100,00 | ||||
| 2026-02-13 | 13F | Stifel Financial Corp | 212.394 | 16,49 | 2.394 | 11,04 | ||||
| 2026-02-13 | 13F | Neuberger Berman Group LLC | 90.273 | 15,26 | 1.017 | 9,95 | ||||
| 2025-11-12 | 13F | Bellwether Advisors, LLC | 0 | -100,00 | 0 | |||||
| 2026-02-06 | 13F | Envestnet Portfolio Solutions, Inc. | 18.287 | 57,84 | 206 | 51,47 | ||||
| 2025-11-14 | 13F | Graham Capital Management, L.P. | 0 | -100,00 | 0 | -100,00 | ||||
| 2026-02-02 | 13F | Mutual Advisors, LLC | 97.553 | -1,92 | 1.099 | -1,43 | ||||
| 2026-02-12 | 13F | Sagil Capital Llp | 0 | -100,00 | 0 | |||||
| 2026-02-13 | 13F | American Century Companies Inc | 4.301.442 | 13,40 | 48.477 | 8,13 | ||||
| 2026-02-17 | 13F | Russell Investments Group, Ltd. | 35.777 | 44,89 | 403 | 38,49 | ||||
| 2025-11-14 | 13F | Trexquant Investment LP | 0 | -100,00 | 0 | |||||
| 2026-03-06 | 13F | Hsbc Holdings Plc | 1.304.301 | 11,69 | 14.699 | 6,48 | ||||
| 2026-02-10 | 13F | Bnp Paribas Arbitrage, Sa | 152.111 | -9,37 | 1.714 | -13,57 | ||||
| 2026-02-05 | 13F | Allworth Financial LP | 13.349 | 2,99 | 150 | -1,96 | ||||
| 2026-04-20 | 13F | Ronald Blue Trust, Inc. | 3.724 | 5,23 | 70 | 76,92 | ||||
| 2026-02-05 | 13F | Bessemer Group Inc | 20.762 | -0,13 | 0 | |||||
| 2025-11-14 | 13F | Squarepoint Ops LLC | 0 | -100,00 | 0 | |||||
| 2026-02-06 | 13F | Profund Advisors Llc | 109.834 | 10,73 | 1.238 | 5,55 | ||||
| 2026-02-17 | 13F | Advisor Group Holdings, Inc. | 3.811 | -26,47 | 43 | -31,15 | ||||
| 2026-04-15 | 13F | FNY Investment Advisers, LLC | 240 | 0 | ||||||
| 2026-02-13 | 13F | Morgan Stanley | 1.598.802 | 29,74 | 18.019 | 23,70 | ||||
| 2026-02-11 | 13F | LPL Financial LLC | 128.947 | 32,78 | 1.453 | 26,68 | ||||
| 2026-02-12 | 13F | Callan Family Office, LLC | 119.294 | 1.344 | ||||||
| 2026-01-29 | 13F | Concurrent Investment Advisors, LLC | 13.496 | 0,00 | 152 | -4,40 | ||||
| 2026-04-21 | 13F | PharVision Advisers, LLC | 0 | -100,00 | 0 | |||||
| 2026-04-24 | 13F | Deltec Asset Management Llc | 19.500 | -6,02 | 366 | 56,65 | ||||
| 2026-02-12 | 13F | Renaissance Technologies Llc | 4.485.600 | -11,68 | 50.553 | -15,79 | ||||
| 2025-11-14 | 13F | Scientech Research LLC | 0 | -100,00 | 0 | -100,00 | ||||
| 2026-02-13 | 13F/A | Alberta Investment Management Corp | 0 | -100,00 | 0 | |||||
| 2026-01-26 | 13F | Mirae Asset Global Investments Co., Ltd. | 124.916 | 3,11 | 1.408 | -1,68 | ||||
| 2026-02-17 | 13F | Silvercrest Asset Management Group Llc | 10.935 | 123 | ||||||
| 2026-02-11 | 13F | Metis Global Partners, LLC | 13.077 | -3,00 | 147 | -7,55 | ||||
| 2025-11-14 | 13F | Tudor Investment Corp Et Al | 0 | -100,00 | 0 | |||||
| 2026-02-17 | 13F | Grantham, Mayo, Van Otterloo & Co. LLC | 765.506 | 6,25 | 8.627 | 1,32 | ||||
| 2026-02-17 | 13F | Nomura Holdings Inc | 25.450 | 287 | ||||||
| 2026-04-07 | 13F | Signaturefd, Llc | 2.008 | 0,00 | 38 | 68,18 | ||||
| 2026-04-24 | 13F | Yousif Capital Management, Llc | 27.264 | 0,00 | 511 | 55,79 | ||||
| 2026-01-20 | 13F | Packer & Co Ltd | 3.948.602 | 45 | ||||||
| 2026-04-10 | 13F | Abound Wealth Management | 9 | -67,86 | 0 | |||||
| 2026-02-13 | 13F | Smartleaf Asset Management LLC | 597 | 0,00 | 7 | -14,29 | ||||
| 2026-02-13 | 13F | Pinnacle Wealth Planning Services, Inc. | 1.558 | 18 | ||||||
| 2026-02-10 | 13F | Envestnet Asset Management Inc | 301.933 | 14,96 | 3.403 | 9,60 | ||||
| 2026-02-12 | 13F | Skopos Labs, Inc. | 11.182 | 123 | ||||||
| 2026-02-17 | 13F | Creative Planning | 48.762 | -65,17 | 550 | -69,02 | ||||
| 2026-04-20 | 13F | Sowell Financial Services LLC | 25.537 | -16,51 | 479 | 38,95 | ||||
| 2026-02-12 | 13F | Barings Llc | 428.646 | 0,00 | 4.831 | -4,66 | ||||
| 2026-02-13 | 13F | Marshall Wace, Llp | 70.490 | 794 | ||||||
| 2026-01-05 | 13F | Commons Capital, Llc | 120.000 | 0,00 | 1.352 | -4,65 | ||||
| 2026-02-13 | 13F | Ranmore Fund Management Ltd | 0 | -100,00 | 0 | |||||
| 2026-02-12 | 13F | Dimensional Fund Advisors Lp | 7.090.175 | 6,18 | 79.912 | 1,22 | ||||
| 2026-02-17 | 13F | Schonfeld Strategic Advisors LLC | 45.862 | 517 | ||||||
| 2026-02-17 | 13F | Legend Capital Advisors LLC | 20.660 | 233 | ||||||
| 2026-02-13 | 13F | Kestra Advisory Services, LLC | 2.290 | 26 | ||||||
| 2026-02-23 | 13F | Virtu Financial LLC | 0 | -100,00 | 0 | |||||
| 2026-01-28 | 13F | N.E.W. Advisory Services LLC | 150 | 0,00 | 2 | 0,00 | ||||
| 2026-02-17 | 13F | DV Trading LLC | 154.512 | 1.821 | ||||||
| 2026-02-13 | 13F | SPX Equities Gestao de Recursos Ltda | 1.173.051 | -32,67 | 13.220 | -35,80 | ||||
| 2026-02-17 | 13F | Two Sigma Securities, Llc | 15.821 | 178 | ||||||
| 2026-02-24 | 13F | DGS Capital Management, LLC | 0 | -100,00 | 0 | |||||
| 2026-02-12 | 13F | Banco BTG Pactual S.A. | 26.850 | 108,14 | 303 | 98,68 | ||||
| 2026-02-09 | 13F | Hantz Financial Services, Inc. | 234.500 | -0,97 | 3 | 0,00 | ||||
| 2025-11-10 | 13F | Optiver Holding B.V. | 0 | -100,00 | 0 | |||||
| 2025-11-10 | 13F | MAI Capital Management | 0 | -100,00 | 0 | |||||
| 2026-02-09 | 13F | Geode Capital Management, Llc | 470.038 | -2,51 | 5.297 | -7,05 | ||||
| 2026-02-17 | 13F | Raymond James Financial Inc | 19.272 | -13,63 | 217 | -17,49 | ||||
| 2026-02-17 | 13F | HighVista Strategies LLC | 55.200 | -60,06 | 622 | -61,91 | ||||
| 2026-02-06 | 13F | EverSource Wealth Advisors, LLC | 1.998 | 31,10 | 23 | 22,22 | ||||
| 2025-11-14 | 13F | PineBridge Investments, L.P. | 254.998 | 0,00 | 3.014 | 2,45 | ||||
| 2026-02-11 | 13F | Brandes Investment Partners, Lp | 5.492.474 | 4,45 | 61.900 | -0,41 | ||||
| 2026-02-17 | 13F | Ameriprise Financial Inc | 22.214 | -3,70 | 257 | -7,58 | ||||
| 2026-02-12 | 13F | Advisors Asset Management, Inc. | 44.162 | -48,72 | 498 | -51,18 | ||||
| 2026-04-17 | 13F | HHM Wealth Advisors, LLC | 50 | 0,00 | 1 | |||||
| 2026-02-17 | 13F | Man Group plc | 0 | -100,00 | 0 | |||||
| 2026-02-13 | 13F | VPR Management LLC | 154.260 | 0,00 | 1.739 | -4,66 | ||||
| 2026-04-24 | 13F | Deprince Race & Zollo Inc | 422.169 | 110,91 | 7.916 | 251,00 | ||||
| 2026-02-19 | 13F | CI Private Wealth, LLC | 71.057 | 4,31 | 801 | -0,62 | ||||
| 2026-02-17 | 13F | Quantinno Capital Management LP | 49.303 | 556 | ||||||
| 2026-02-17 | 13F | Port Capital LLC | 62.467 | 0,00 | 704 | -4,61 | ||||
| 2026-02-12 | 13F/A | Pinebridge Investments Llc | 251.573 | 2.835 | ||||||
| 2026-02-12 | 13F | Bank Of Montreal /can/ | 91.752 | 21,48 | 1.034 | 15,92 | ||||
| 2026-02-10 | 13F | Natixis Advisors, L.p. | 54.866 | -80,82 | 1 | -100,00 | ||||
| 2026-01-23 | 13F | Lester Murray Antman dba SimplyRich | 27.731 | 0,00 | 0 | |||||
| 2026-04-08 | 13F | Wealth Enhancement Advisory Services, Llc | 16.875 | -73,33 | 315 | -54,95 | ||||
| 2026-01-09 | 13F | Oldfield Partners LLP | 90.542 | -55,89 | 1.020 | -57,94 | ||||
| 2026-02-09 | 13F | Wellington Shields Capital Management, LLC | 100.000 | 0,00 | 1.127 | -4,65 | ||||
| 2026-02-17 | 13F | Advisory Services Network, LLC | 0 | -100,00 | 0 | |||||
| 2026-02-13 | 13F | Headlands Technologies LLC | 0 | -100,00 | 0 | |||||
| 2026-02-17 | 13F | Delaware Management Holdings, Inc. | 6.185.509 | 69.711 | ||||||
| 2026-02-04 | 13F | Independent Advisor Alliance | 25.011 | 4,66 | 282 | -0,35 | ||||
| 2026-02-13 | 13F | Schroder Investment Management Group | 1.824.601 | 119,77 | 20.636 | 108,70 | ||||
| 2026-04-20 | 13F | Obermeyer Wood Investment Counsel, Lllp | 117.495 | -0,03 | 2.203 | 66,39 | ||||
| 2026-01-30 | 13F | Bogart Wealth, LLC | 25.324 | 1,30 | 285 | -3,39 | ||||
| 2026-02-03 | 13F | Ballentine Partners, LLC | 0 | -100,00 | 0 | |||||
| 2026-02-19 | 13F | Mcguire Capital Advisors Inc | 300 | 3 | ||||||
| 2026-02-11 | 13F | O'shaughnessy Asset Management, Llc | 12.309 | -12,68 | 139 | -16,87 | ||||
| 2026-02-17 | 13F | Ancora Advisors, LLC | 42 | -91,10 | 0 | -100,00 | ||||
| 2026-02-13 | 13F | Ubs Asset Management Americas Inc | 1.987 | 22 | ||||||
| 2025-11-13 | 13F | Guggenheim Capital Llc | 0 | -100,00 | 0 | |||||
| 2026-02-11 | 13F | Jpmorgan Chase & Co | 30.568.184 | 37,10 | 344.503 | 30,72 | ||||
| 2026-02-17 | 13F | EFG International AG | 4.500 | 51 | ||||||
| 2026-02-13 | 13F | Itau Unibanco Holding S.A. | 9.218.618 | 44,05 | 103.249 | 36,49 | ||||
| 2026-02-13 | 13F | Caitong International Asset Management Co., Ltd | 11.123 | 370.666,67 | 125 | |||||
| 2026-02-13 | 13F | Verition Fund Management LLC | 0 | -100,00 | 0 | |||||
| 2026-02-13 | 13F | Barclays Plc | 1.090.567 | -5,45 | 12.291 | -9,85 | ||||
| 2025-11-07 | 13F | Fifth Third Bancorp | 0 | -100,00 | 0 | -100,00 | ||||
| 2026-02-17 | 13F | Bulltick Wealth Management, LLC | 14.079 | 17,50 | 163 | 13,19 | ||||
| 2026-02-17 | 13F | Amundi | 6.701.950 | 1,81 | 75.531 | -0,66 | ||||
| 2026-01-30 | 13F | Us Bancorp \de\ | 13.427 | 24,22 | 151 | 18,90 | ||||
| 2026-02-19 | 13F | Invesco Ltd. | 3.559.972 | 39,81 | 40.121 | 33,31 | ||||
| 2026-02-13 | 13F | First Trust Advisors Lp | 14.273 | 12,64 | 161 | 7,38 | ||||
| 2026-01-29 | 13F | UBS Group AG | 972.264 | 25,54 | 10.957 | 19,70 | ||||
| 2026-01-27 | 13F | TD Waterhouse Canada Inc. | 0 | -100,00 | 0 | |||||
| 2025-10-28 | 13F | Arlington Trust Co LLC | 0 | -100,00 | 0 | |||||
| 2025-11-06 | 13F | Abc Arbitrage Sa | 0 | -100,00 | 0 | |||||
| 2026-02-17 | 13F | Edmond De Rothschild Holding S.a. | 0 | -100,00 | 0 | |||||
| 2026-02-10 | 13F | Eurizon Capital SGR S.p.A. | 740 | 8 | ||||||
| 2026-02-13 | 13F | State Street Corp | 5.003.803 | -10,03 | 56.954 | -15,09 | ||||
| 2026-02-12 | 13F | Hrt Financial Lp | 0 | -100,00 | 0 | |||||
| 2026-02-17 | 13F | Point72 Asset Management, L.P. | 0 | -100,00 | 0 | |||||
| 2026-02-13 | 13F | Focused Alpha, Llc | 15.777 | 178 | ||||||
| 2026-02-06 | 13F | Verde Servicos Internacionais S.A. | 0 | -100,00 | 0 | |||||
| 2026-02-12 | 13F | Wealthspire Advisors, LLC | 0 | -100,00 | 0 | |||||
| 2026-04-13 | 13F | Plan Group Financial, LLC | 30.000 | 0,00 | 562 | 66,27 | ||||
| 2026-02-17 | 13F | Fmr Llc | 4.945.411 | -22,33 | 55.735 | -25,94 | ||||
| 2026-02-13 | 13F | Platinum Investment Management Ltd | 16.148 | -77,70 | 182 | -78,83 |